Reproducing Images
This project reproduces a single image using PyGAD by evolving pixel values. This project works with both color and gray images. Check this project at GitHub: https://github.com/ahmedfgad/GARI.
For more information about this project, read this tutorial titled Reproducing Images using a Genetic Algorithm with Python available at these links:
Heartbeat: https://heartbeat.fritz.ai/reproducing-images-using-a-genetic-algorithm-with-python-91fc701ff84
LinkedIn: https://www.linkedin.com/pulse/reproducing-images-using-genetic-algorithm-python-ahmed-gad
Project Steps
The steps to follow in order to reproduce an image are as follows:
Read an image
Prepare the fitness function
Create an instance of the pygad.GA class with the appropriate parameters
Run PyGAD
Plot results
Calculate some statistics
The next sections discuss the code of each step.
Read an Image
There is an image named fruit.jpg in the GARI project which is read according to the next code.
import imageio
import numpy

target_im = imageio.imread('fruit.jpg')
target_im = numpy.asarray(target_im/255, dtype=float)
Here is the read image.
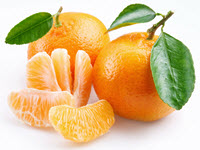
Based on the chromosome representation used in the example, the pixel values can be in the 0-255 range, the 0-1 range, or any other range.
Note that the range of pixel values affects other parameters, like the range from which random values are selected during mutation and the range of values used in the initial population. So, be consistent.
Prepare the Fitness Function
The next code creates a function that will be used as a fitness function for calculating the fitness value for each solution in the population. This function must be a maximization function that accepts 3 parameters representing the instance of the pygad.GA class, a solution, and its index. It returns a value representing the fitness value.
import gari

target_chromosome = gari.img2chromosome(target_im)

def fitness_fun(ga_instance, solution, solution_idx):
    fitness = numpy.sum(numpy.abs(target_chromosome-solution))

    # Negating the fitness value to make it increasing rather than decreasing.
    fitness = numpy.sum(target_chromosome) - fitness
    return fitness
The fitness value is calculated using the sum of absolute difference between genes values in the original and reproduced chromosomes. The gari.img2chromosome() function is called before the fitness function to represent the image as a vector because the genetic algorithm can work with 1D chromosomes.
The implementation of the gari module is available at the GARI GitHub project and its code is listed below.
import numpy
import functools
import operator

def img2chromosome(img_arr):
   return numpy.reshape(img_arr, (functools.reduce(operator.mul, img_arr.shape)))

def chromosome2img(vector, shape):
   if len(vector) != functools.reduce(operator.mul, shape):
       raise ValueError(f"A vector of length {len(vector)} into an array of shape {shape}.")

   return numpy.reshape(vector, shape)
Create an Instance of the pygad.GA Class
It is very important to use random mutation and set the mutation_by_replacement to True. Based on the range of pixel values, the values assigned to the init_range_low, init_range_high, random_mutation_min_val, and random_mutation_max_val parameters should be changed.
If the image pixel values range from 0 to 255, then set init_range_low and random_mutation_min_val to 0 as they are but change init_range_high and random_mutation_max_val to 255.
Feel free to change the other parameters or add other parameters. Please check the PyGAD’s documentation for the full list of parameters.
import pygad

ga_instance = pygad.GA(num_generations=20000,
                       num_parents_mating=10,
                       fitness_func=fitness_fun,
                       sol_per_pop=20,
                       num_genes=target_im.size,
                       init_range_low=0.0,
                       init_range_high=1.0,
                       mutation_percent_genes=0.01,
                       mutation_type="random",
                       mutation_by_replacement=True,
                       random_mutation_min_val=0.0,
                       random_mutation_max_val=1.0)
Run PyGAD
Simply, call the run() method to run PyGAD.
ga_instance.run()
Plot Results
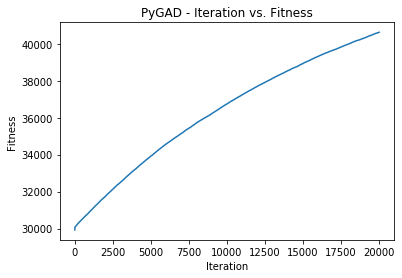
After the run() method completes, the fitness values of all generations can be viewed in a plot using the plot_fitness() method.
ga_instance.plot_fitness()
Here is the plot after 20,000 generations.
Calculate Some Statistics
Here is some information about the best solution.
# Returning the details of the best solution.
solution, solution_fitness, solution_idx = ga_instance.best_solution()
print(f"Fitness value of the best solution = {solution_fitness}")
print(f"Index of the best solution : {solution_idx}")

if ga_instance.best_solution_generation != -1:
    print(f"Best fitness value reached after {ga_instance.best_solution_generation} generations.")

result = gari.chromosome2img(solution, target_im.shape)
matplotlib.pyplot.imshow(result)
matplotlib.pyplot.title("PyGAD & GARI for Reproducing Images")
matplotlib.pyplot.show()
Evolution by Generation
The solution reached after the 20,000 generations is shown below.
After more generations, the result can be improved, as shown below.
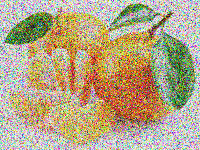
The results can also be enhanced by changing the parameters passed to the constructor of the pygad.GA class.
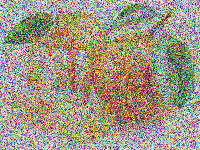
Here is how the image evolves from generation 0 to generation 20,000.
Generation 0
Generation 1,000
Generation 2,500
Generation 4,500
Generation 7,000
Generation 8,000
Generation 20,000